2025
2025
Finance Dashboard
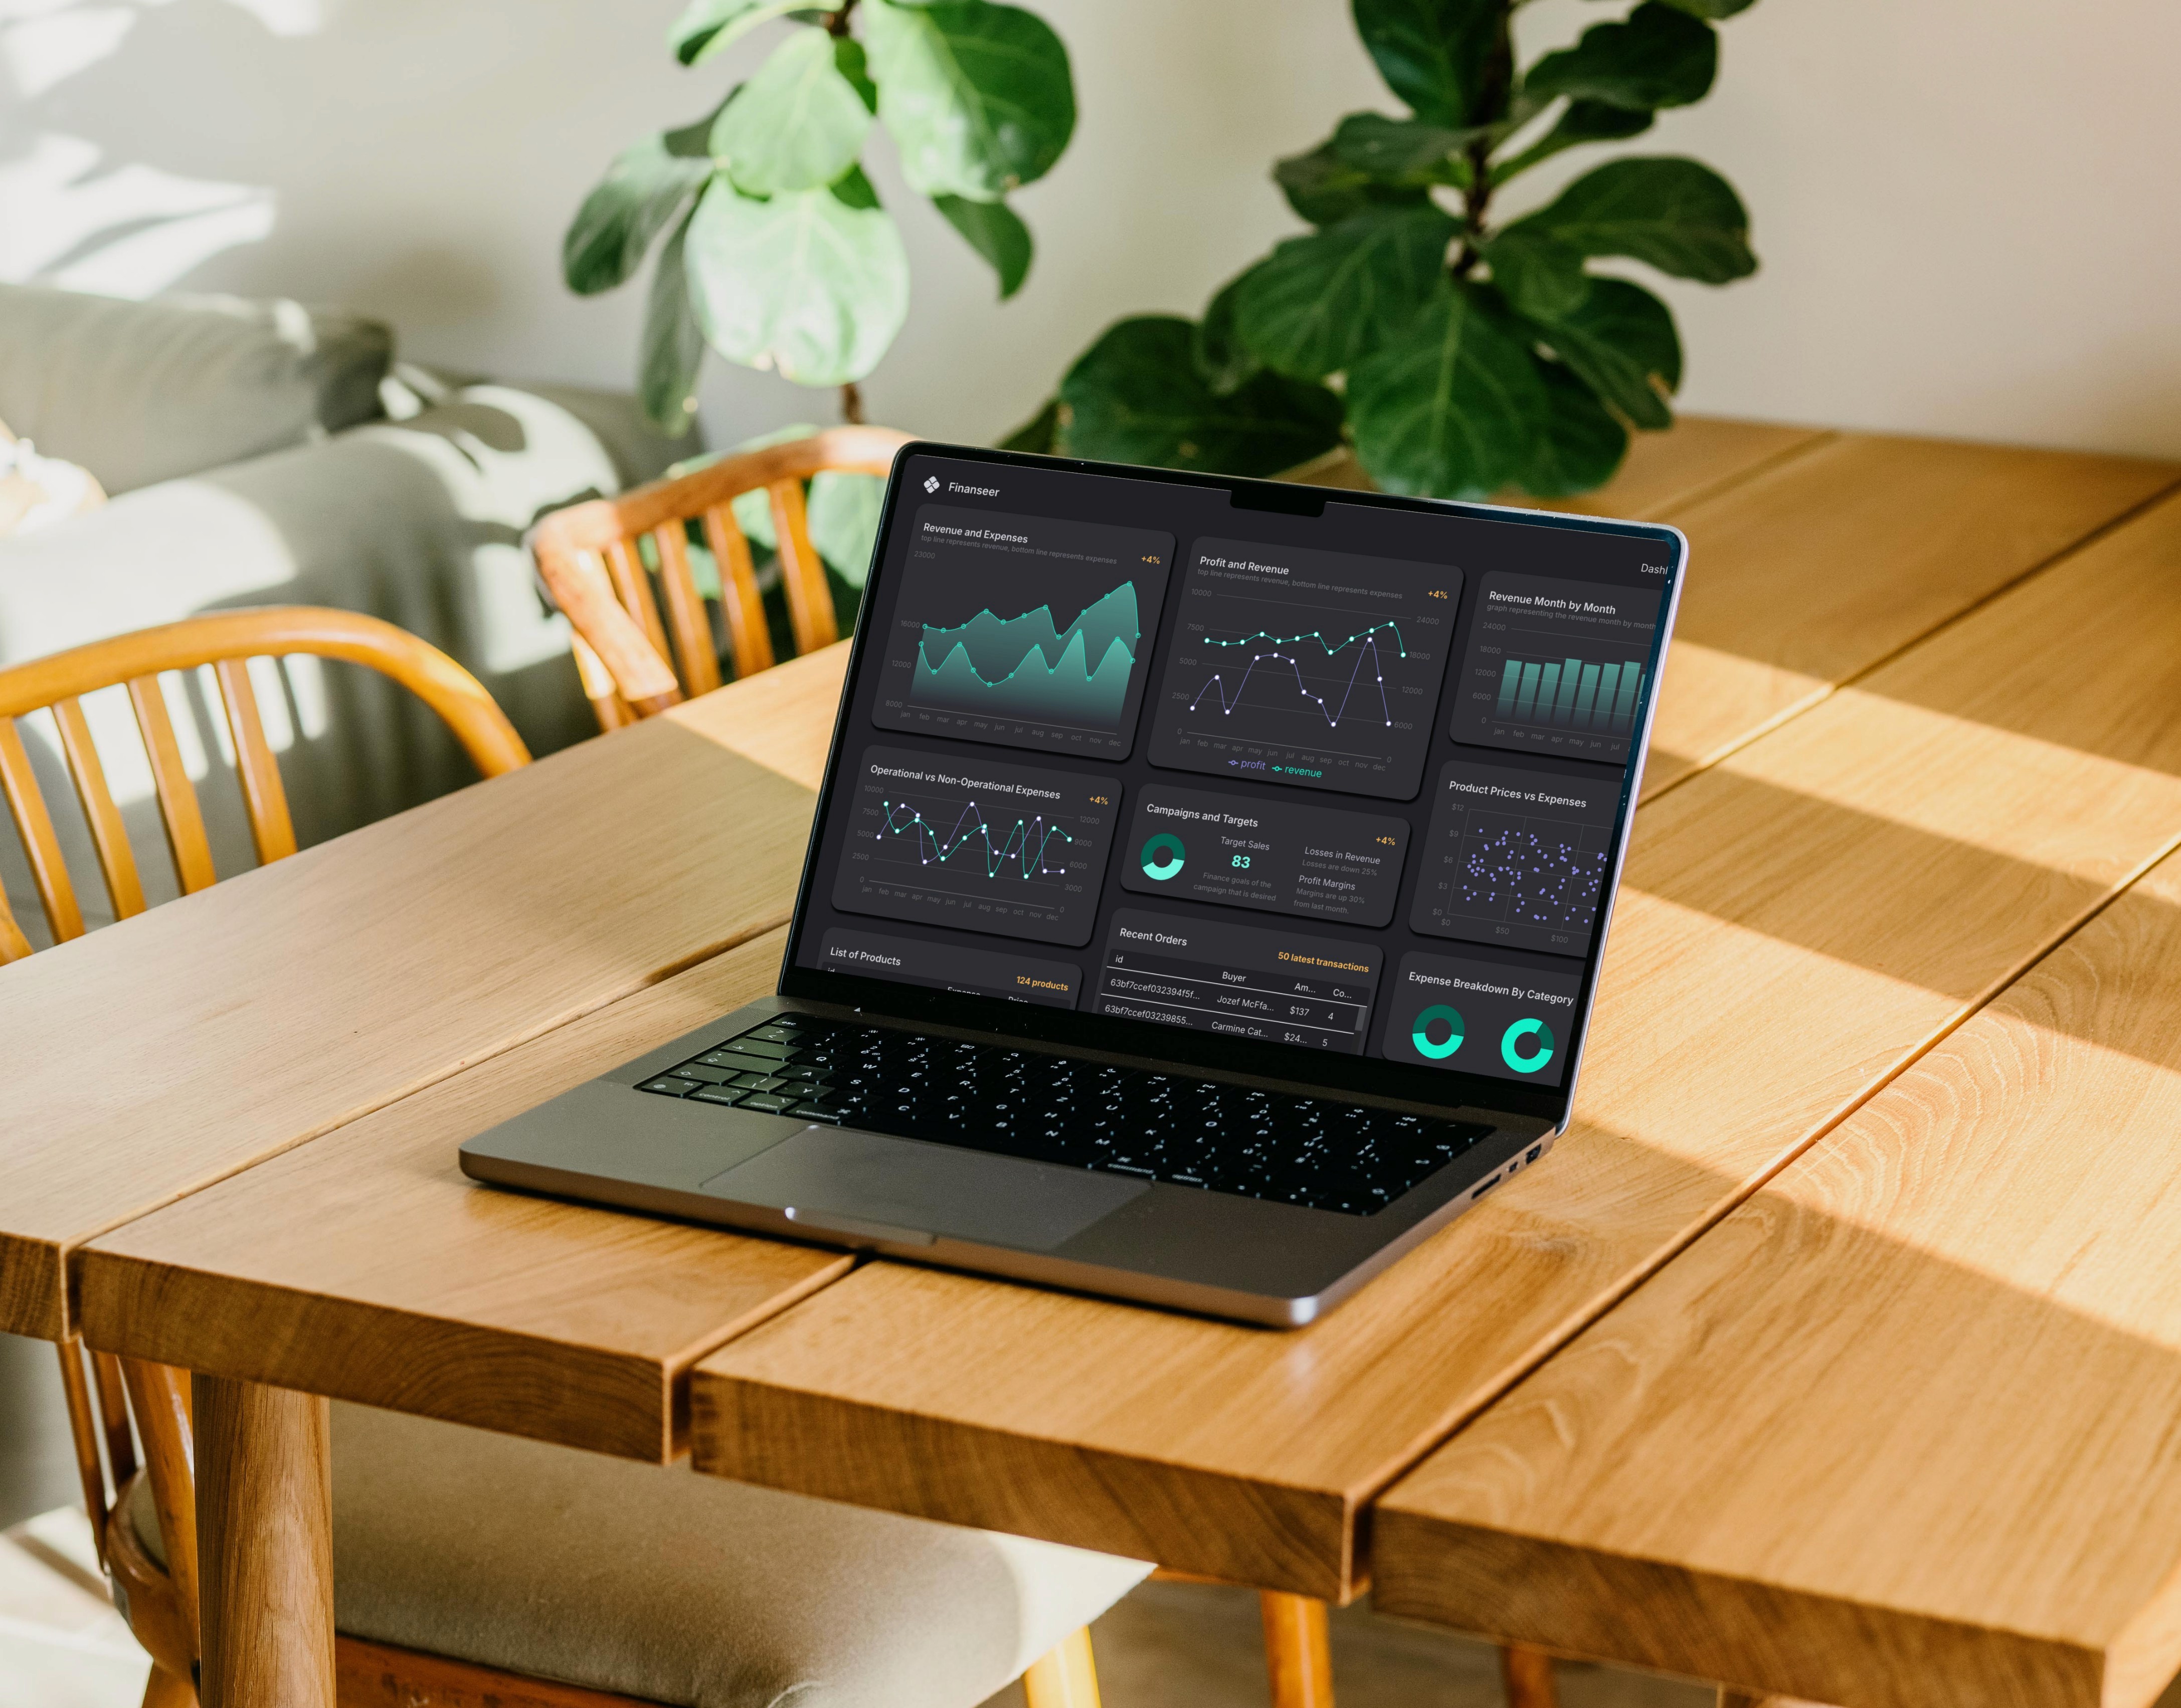
An intelligent finance dashboard that visualizes revenue and profit trends, with ML-powered predictions to guide business decisions.
Web App
Machine Learning
Inspiration
The dashboard was inspired by the need to turn raw financial data into clear insights, empowering users to understand their growth and predict what’s next.®
To help users make smarter financial decisions through intuitive data visualization and intelligent revenue forecasting.
Problem
Most business dashboards are either too basic or overly complex. At one end, users rely on plain tables or static spreadsheets that only show raw revenue and profit data with zero context. At the other end, enterprise tools offer forecasting and reporting, but are bloated, expensive, and not built for small businesses or developers who want control.
There’s also a disconnect between what users see and what they can do with the data. Seeing past numbers isn’t enough; what people really need is the ability to spot trends, compare performance month-over-month, and make sense of where they’re headed. And for developers building finance tools, plugging in real-time charts and prediction logic without bloating the frontend or dealing with endless integrations is a constant struggle.

Solution
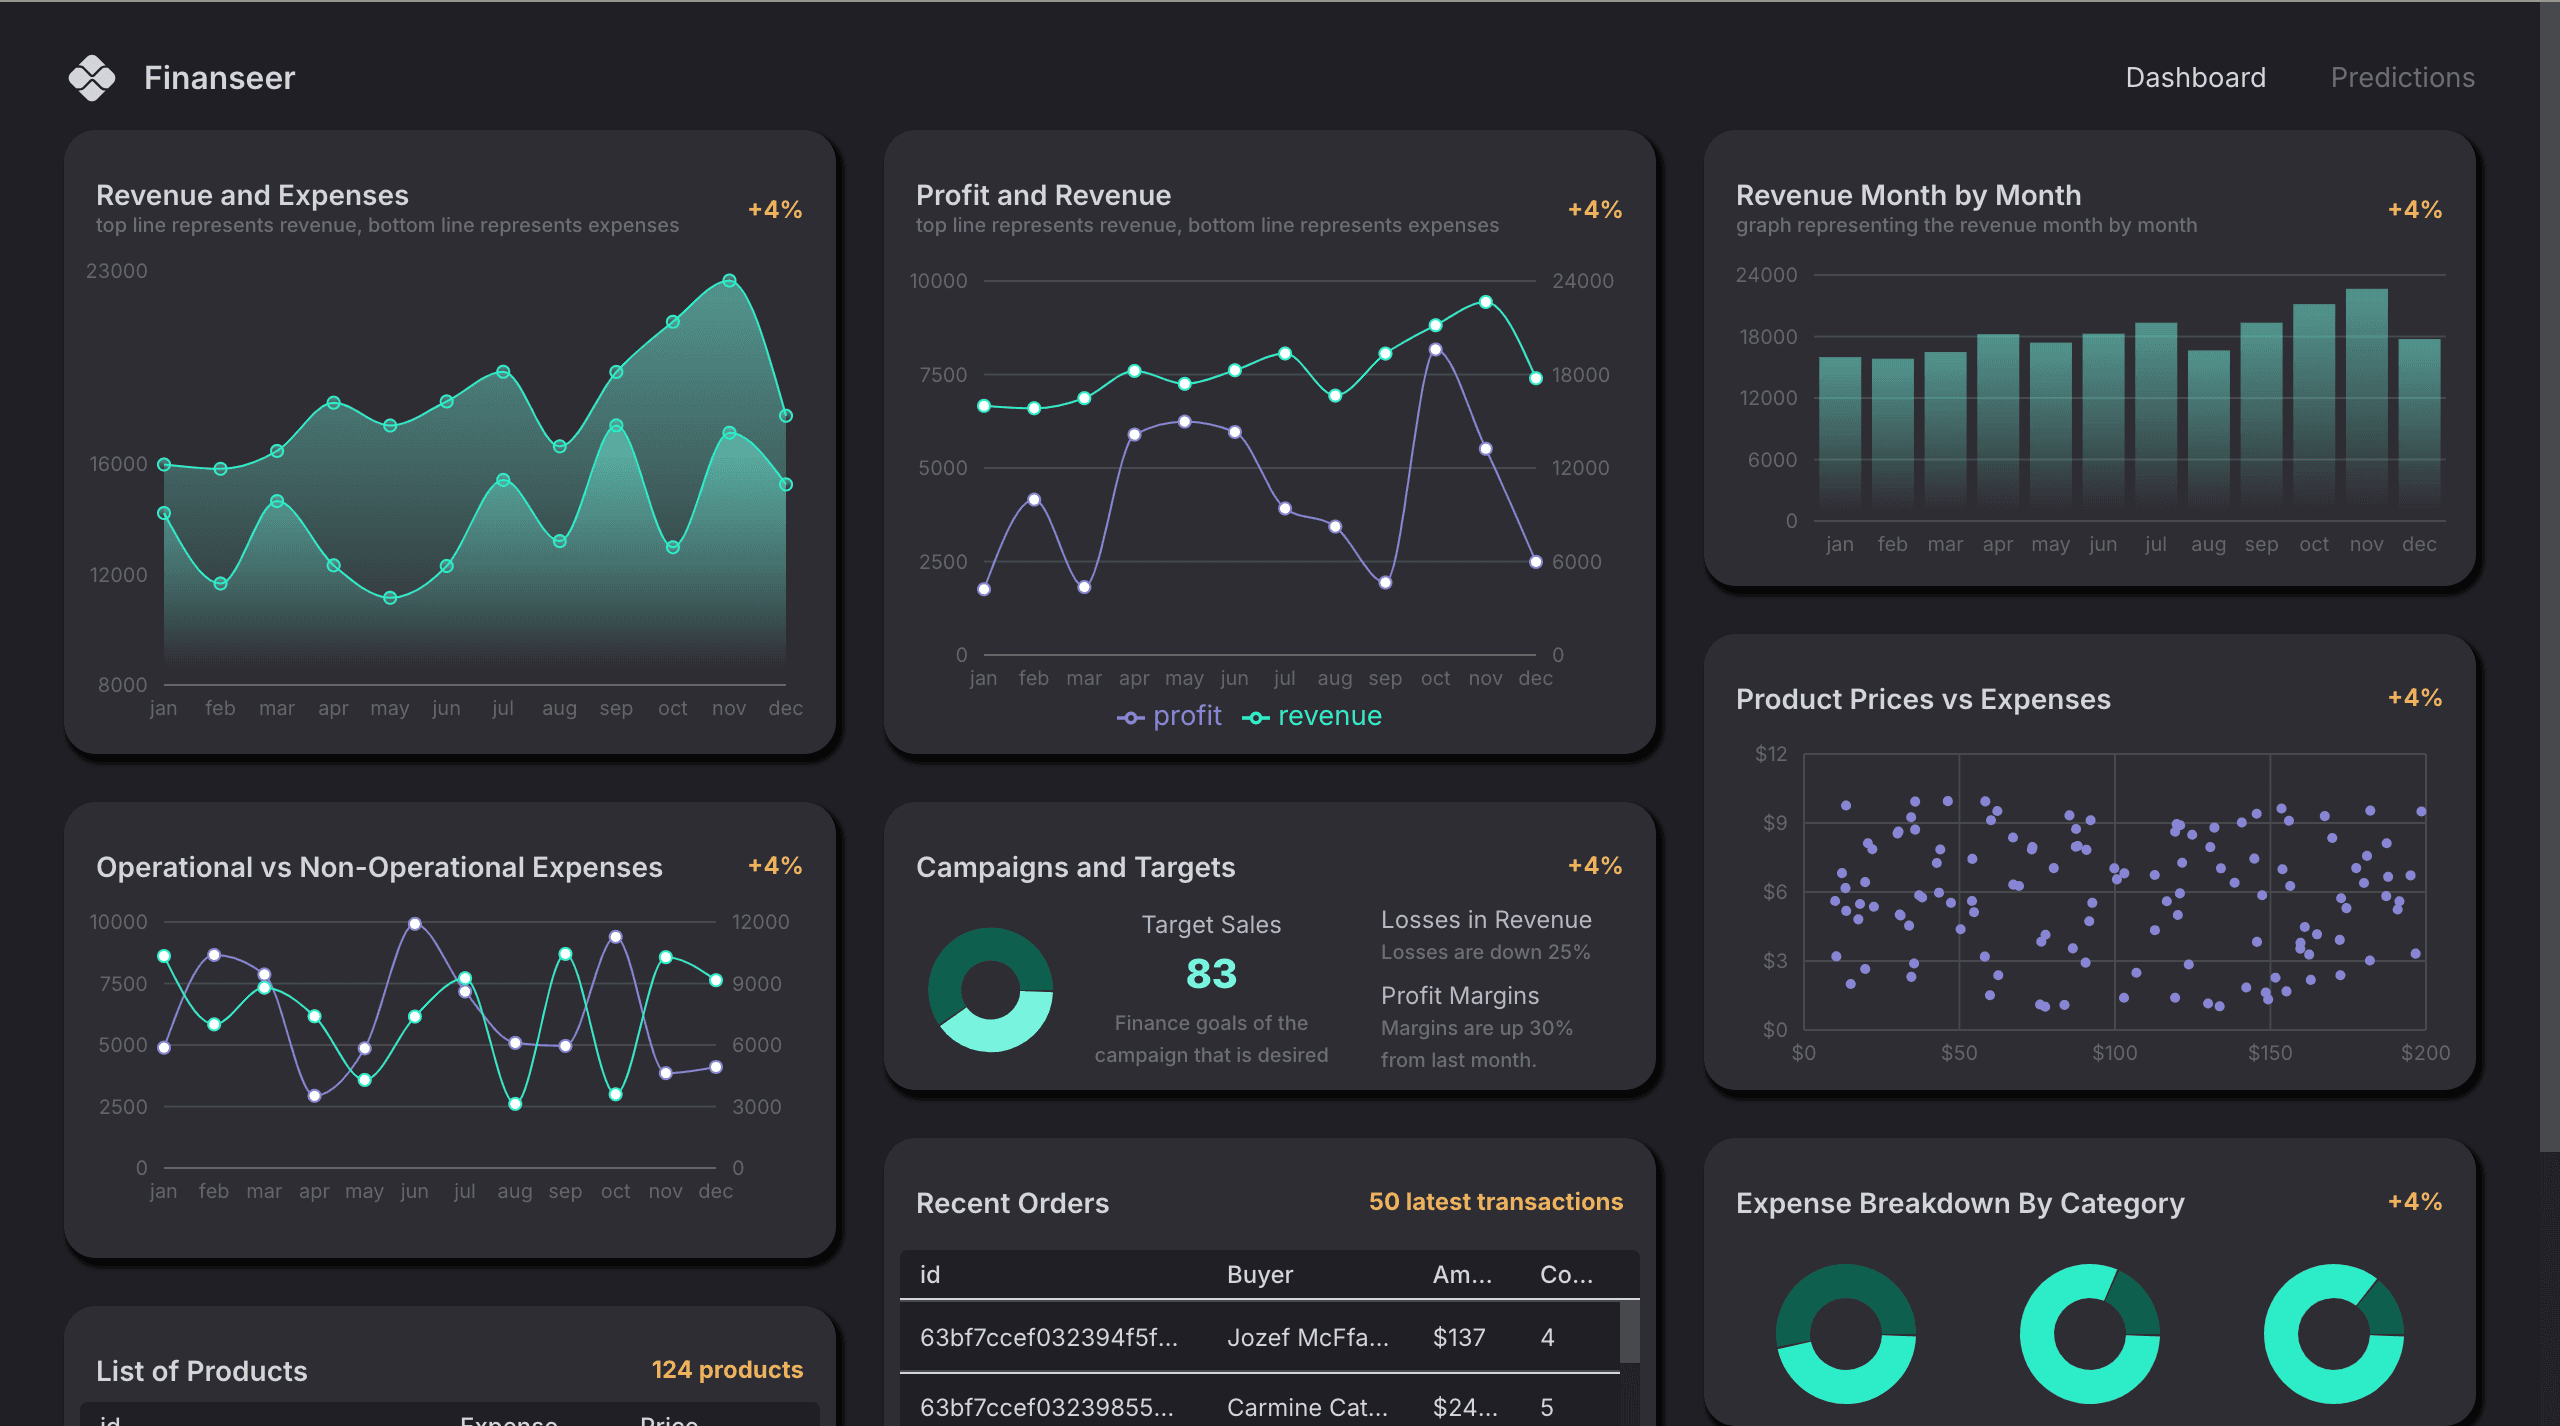
This Finance Dashboard was built to strip away the fluff and deliver exactly what users need: a real-time view of revenue and profit, displayed through clean and responsive visualizations. Using Recharts, users can filter and interact with data to track how their business is actually performing, not just how it performed.
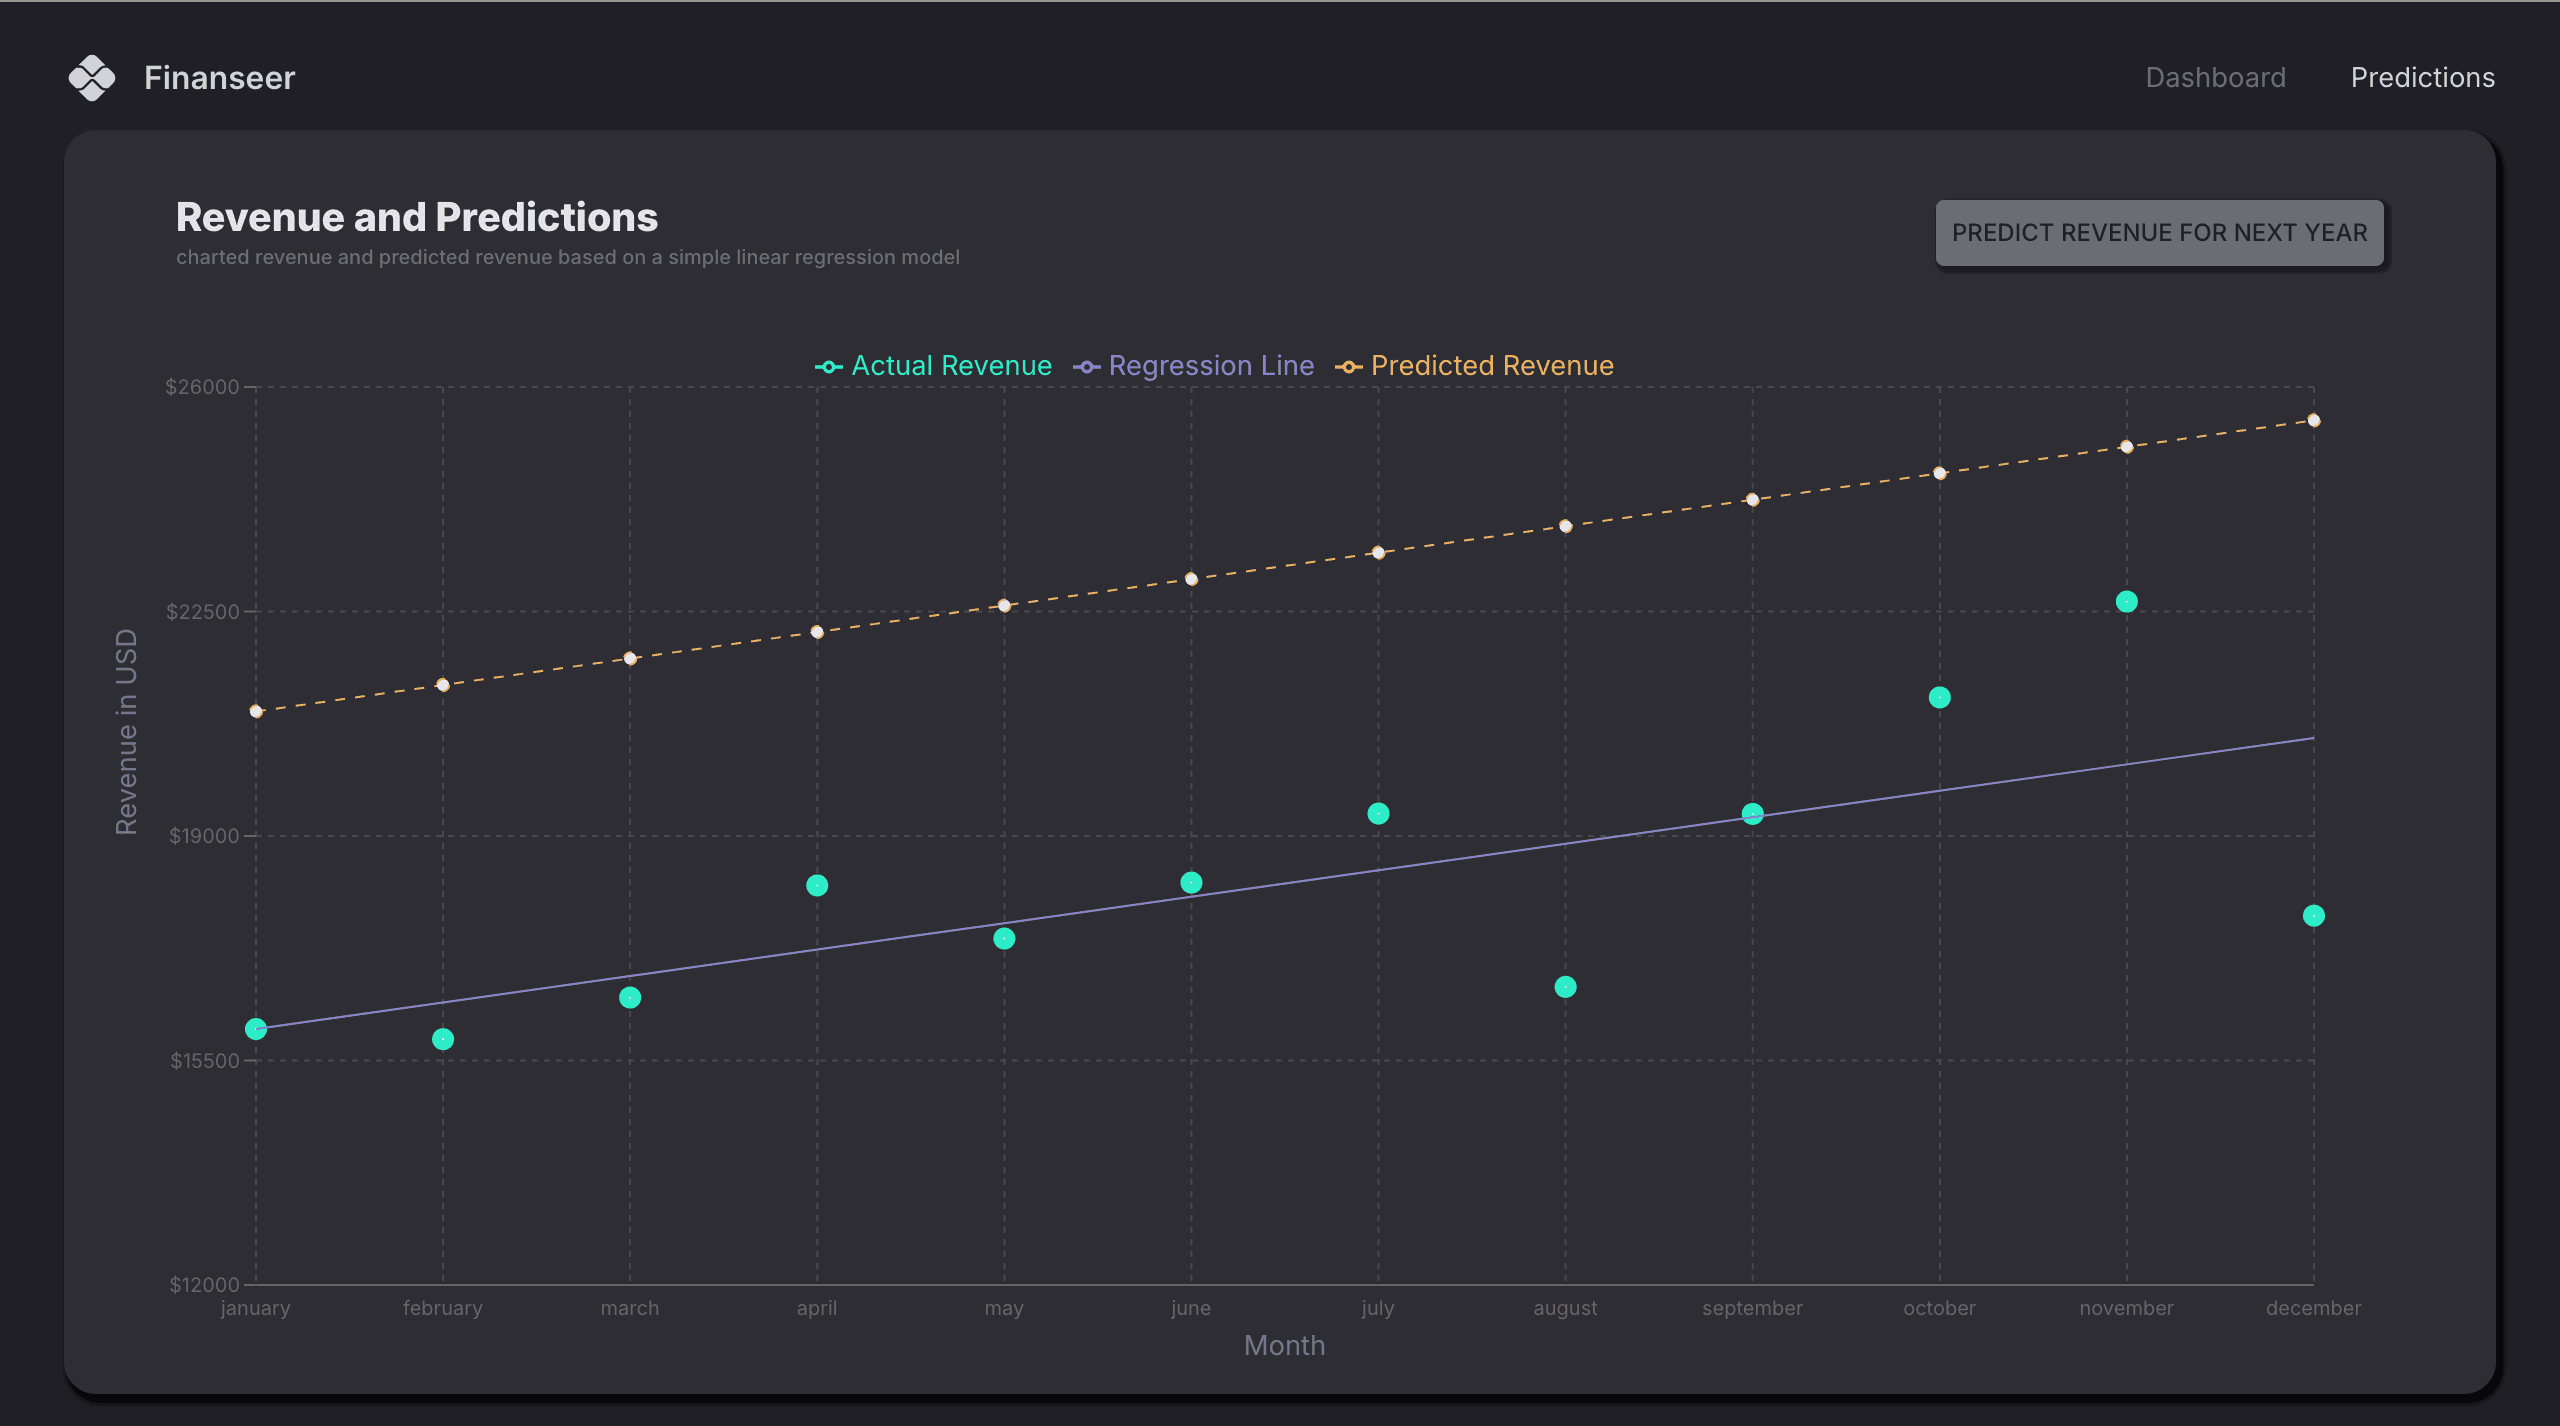
On the backend, MongoDB and Express handle secure, efficient data flow, while React and Material UI bring structure and clarity to the frontend UI. But the real differentiator is the built-in machine learning model that runs historical revenue through a basic prediction algorithm, outputting a realistic forecast of where the business might be financially a year from now.
More Works
©2025

FAQ
01
What services does browwwse offer?
02
How is the pricing structure?
03
Are all projects fixed scope?
04
What is the ROI?
05
How do we measure success?
06
What do I need to get started?
07
Do you offer ongoing support after the project is completed?
08
Do you work with clients from outside Nigeria?
2025
Finance Dashboard
An intelligent finance dashboard that visualizes revenue and profit trends, with ML-powered predictions to guide business decisions.
Web App
Machine Learning
Inspiration
The dashboard was inspired by the need to turn raw financial data into clear insights, empowering users to understand their growth and predict what’s next.®
To help users make smarter financial decisions through intuitive data visualization and intelligent revenue forecasting.
Problem
Most business dashboards are either too basic or overly complex. At one end, users rely on plain tables or static spreadsheets that only show raw revenue and profit data with zero context. At the other end, enterprise tools offer forecasting and reporting, but are bloated, expensive, and not built for small businesses or developers who want control.
There’s also a disconnect between what users see and what they can do with the data. Seeing past numbers isn’t enough; what people really need is the ability to spot trends, compare performance month-over-month, and make sense of where they’re headed. And for developers building finance tools, plugging in real-time charts and prediction logic without bloating the frontend or dealing with endless integrations is a constant struggle.
Solution
This Finance Dashboard was built to strip away the fluff and deliver exactly what users need: a real-time view of revenue and profit, displayed through clean and responsive visualizations. Using Recharts, users can filter and interact with data to track how their business is actually performing, not just how it performed.
On the backend, MongoDB and Express handle secure, efficient data flow, while React and Material UI bring structure and clarity to the frontend UI. But the real differentiator is the built-in machine learning model that runs historical revenue through a basic prediction algorithm, outputting a realistic forecast of where the business might be financially a year from now.
More Works
©2025
FAQ
What services does browwwse offer?
How is the pricing structure?
Are all projects fixed scope?
What is the ROI?
How do we measure success?
What do I need to get started?
Do you offer ongoing support after the project is completed?
Do you work with clients from outside Nigeria?